Crosstab Reports
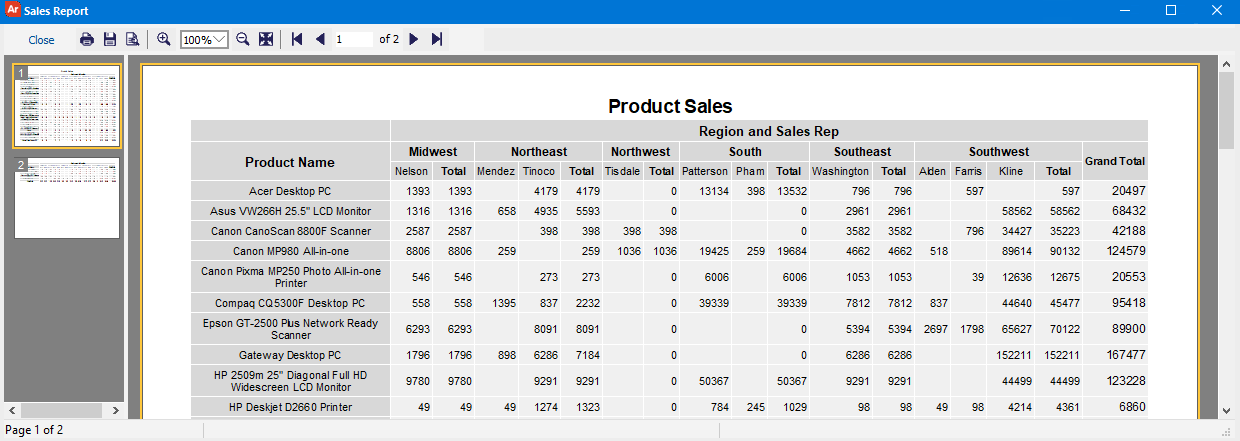
Crosstab reports provide an easy way to relate two or more data attributes in a simple table format. The output is displayed as a table within a PDF document.
The Crosstab Editor allows you to specify which fields from the report query should be displayed as the rows and columns, and which field represents the numerical data to display in the table cells. You can also apply basic formatting to the report, such as headers and footers, colors, font styles, and text.
Creating a Crosstab Report
To create a new crosstab report:
- Ensure the DataBlock contains a report query that returns the desired information from your database.
- Select the DataBlock and then click the New button under Report Writer Actions.
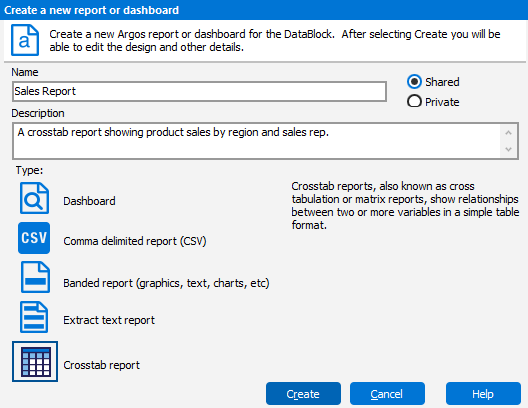
- Give the report a name and description.
- Select Crosstab report as the report type.
- Click the Create button to open the Edit Report dialog.
- Click the Design button to open the Crosstab Report Editor.
Designing the Report
The Crosstab Report Editor is where you design the layout of your report.
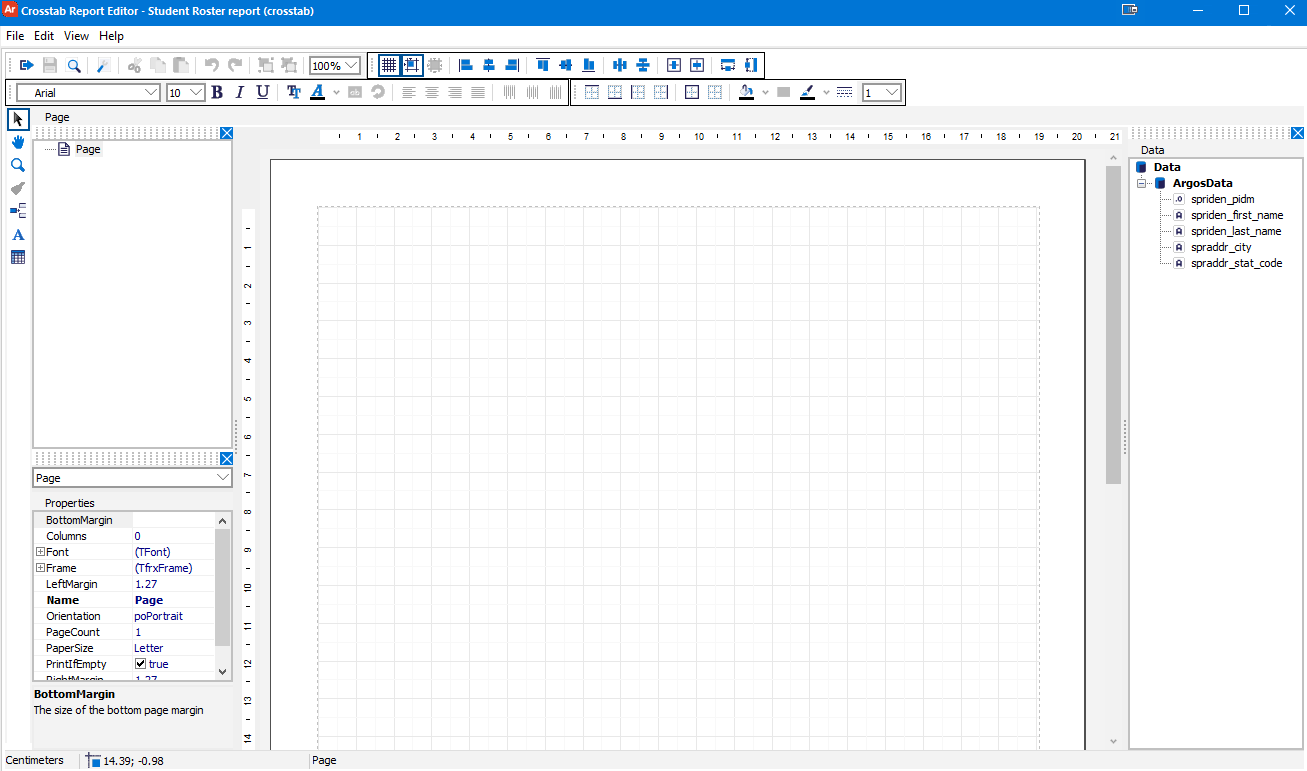
The Object toolbar on the left side of the editor contains three types of objects that you can add to the report:
- Insert Band - Add a title band, page header band, or footer band to the report. Title bands appear once at the start of the report. Page header bands appear at the top of every page, and footers appear at the bottom of every page.
- Add Text Object - Add plain text to a band or other location on the page. If you want to create a title at the top of your report, you would first add the title band, and then add a text object to the title band.
- Draw Crosstab Object - Add the actual crosstab object to the report. After selecting the button, click anywhere on the page to add the object. The Crosstab Editor dialog will then open, where you can configure the data to be included in the report.
You can use the various alignment tools to arrange text and crosstab objects in relation to each other, their parent bands, or to the page.

Crosstab Editor
After adding a crosstab object to the report, the Crosstab Editor dialog is where you set up the crosstab report table.
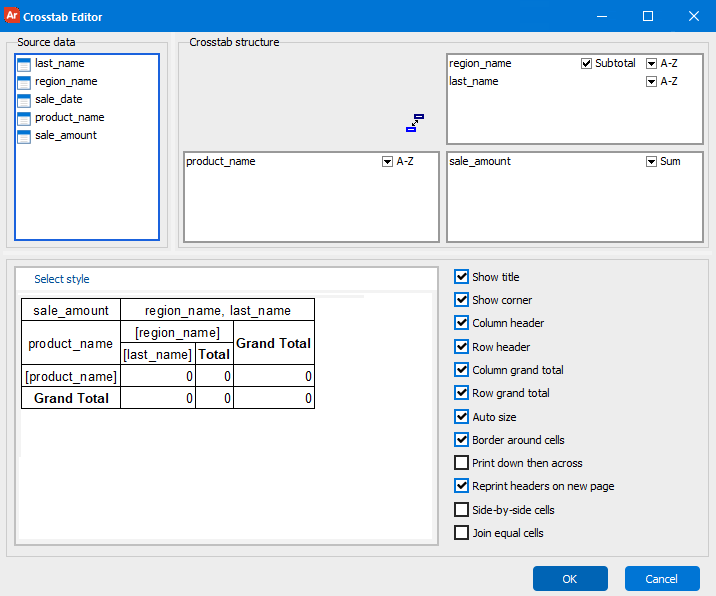
The Source data pane contains a list of all of the available fields from the report query. To design the crosstab table, drag and drop these fields into the Crosstab structure area. Fields in the bottom left box will become the table rows, and fields in the upper right box will become the table columns. The lower right box should contain the field that represents the numerical data that you wish to view. In the example above, we are looking at sales totals, with the product names as the rows and the regions and sales rep names as the columns.
- You can use the preview window at the bottom to see how your report will look.
- The Select style link in the preview pane lets you choose from a predefined list of colors for the table.
- Checkboxes control showing or hiding titles, row/column headers, row/column totals, and let you configure various display options.
- Dropdown arrows next to each row and column field let you specify the sort order or grouping behavior.
- If you include more than one field in the rows or columns and are using an aggregate function for your numeric data (see below), you can choose whether or not you want to show a subtotal row/column in addition to the overall totals at the end.
- Dropdown arrows next to numerical data fields let you choose an aggregation method, such as sum, min, max, average, or count. The default is Sum.
After configuring the crosstab data, select OK to insert the crosstab object into the report.
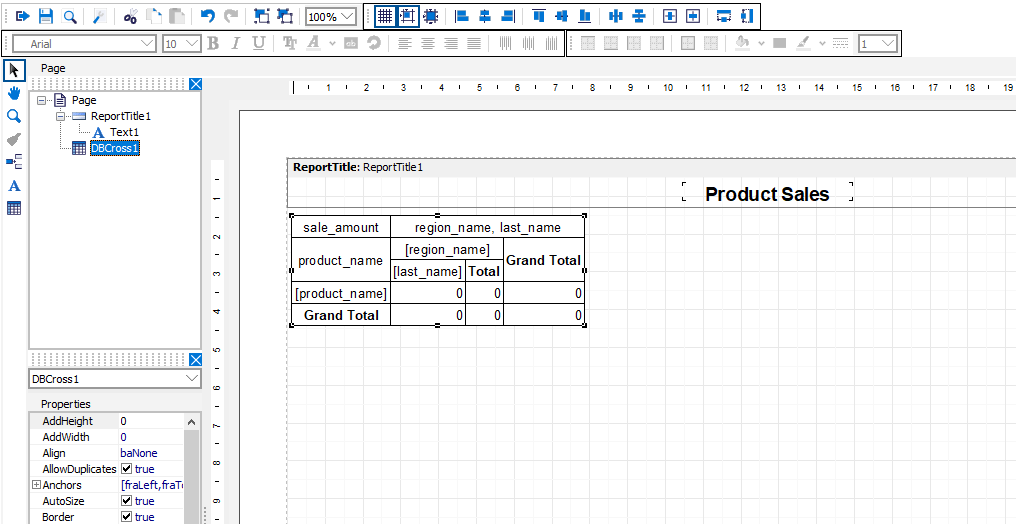
Report Formatting
Notice the structure pane in the upper left now includes an object called DBCross1, which is the crosstab object we just added. Clicking on the object name will select it so that you can move or format it. Double-clicking on the object name or on the crosstab object will open the Crosstab Editor again so you can change settings.
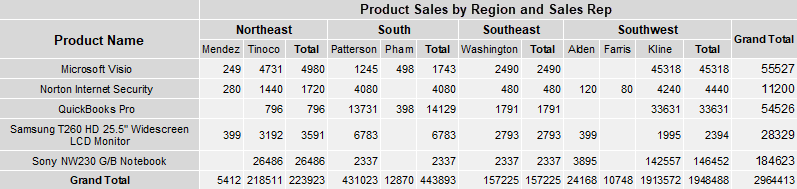
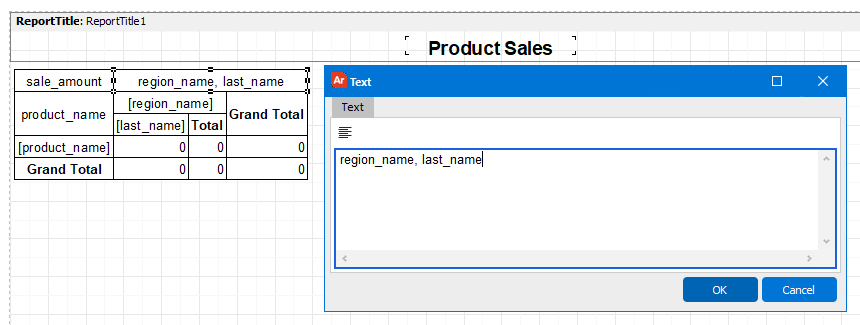
To make the crosstab table easier to read, you may want to rename the column headers so that they are formatted differently or use friendlier names. Double click on any of the row or column headers to edit the text in that cell.
You can change the font for the crosstab object or for individual headers or table cells using the Font toolbar at the top of the screen.

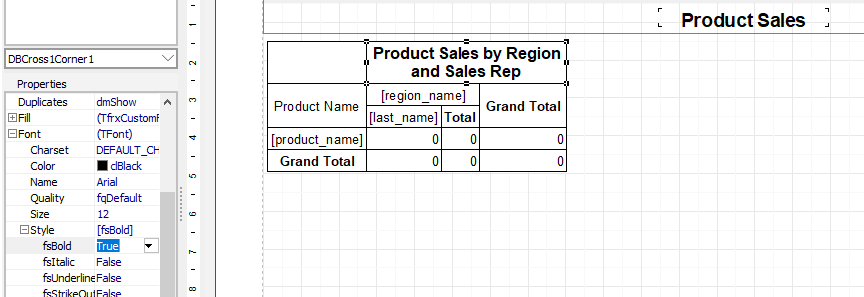
For this report, we want to make the headers bold and larger than the other text. For each header cell we want to change, we will first select the cell. Then, we will make it bold and increase the font size to 12.
The Background and Border toolbar allows you to change the lines and colors used in the report.

For example, you may want to darken the header cells so that they stand out better from the rest of the report.
Formatting and other properties can also be changed via the Properties pane in the lower left, which includes more advanced options than can be configured using the toolbars. A full list of
Report Preview
When you are finished configuring the report, you can use the Preview button ![]() on the first toolbar at the top of the screen to see how the report will look when run.
on the first toolbar at the top of the screen to see how the report will look when run.