Dashboards
All DataBlocks have at least one dashboard which is created on the Form Design pane in the DataBlock. The dashboard is used to gather any input parameters that are needed when you run a report. Dashboards can also display results on the screen, if the DataBlock designer configured it to do so.
Dashboards are a good choice when you need to access information quickly, but do not need to save results as you might when running a report. A good example is a situation where you want to view sales results for the organization. The dashboard could display a sales summary by region for each quarter. It may have additional "drill down" functionality on the dashboard, such as the monthly sales results for each salesperson. The results display on the screen immediately.
In order to save and share data with other users, you can run a report to generate a PDF of the same data, based on the information and options entered into the dashboard. In this case, you can run a banded report from the dashboard, and then send this PDF to the desired recipient.

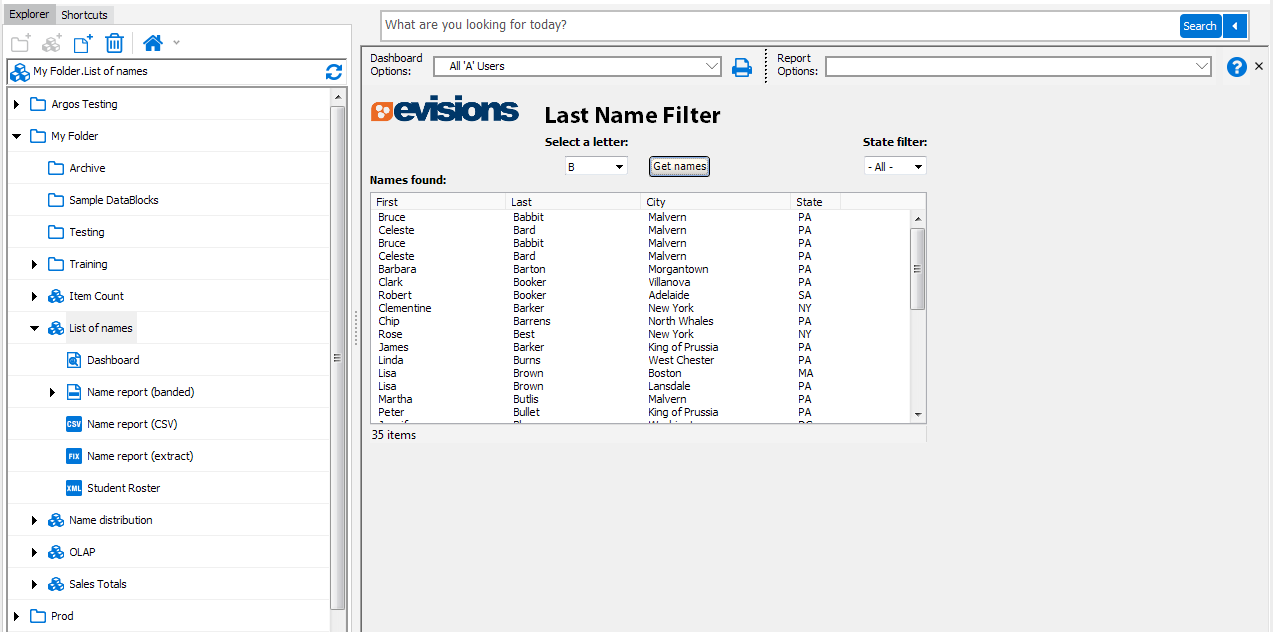
In the screenshot above, the dashboard on the right executes when launching the "List of names" DataBlock. This dashboard is the default (system) dashboard for this DataBlock. You can run any of the reports associated with this DataBlock by selecting the appropriate report in the Report Options drop down at the top of the dashboard. The report will include names beginning with the same letter you selected on the dashboard.
Default Dashboard
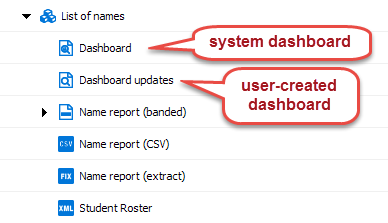
When a DataBlock is created, Argos also creates a default (system) dashboard, which is shown with a small padlock. The system dashboard is named "Dashboard" and cannot be renamed or deleted. DataBlock Designers may create additional dashboards by right-clicking on the DataBlock and selecting New -> Report or Dashboard.

Running a Dashboard
You may run a dashboard by any of the following methods:
- Click on the Run Dashboard button when the dashboard is selected.

- Right-click on the dashboard icon and select Run Dashboard from the menu.
- Double-click on the dashboard.
- Right-click on the DataBlock and select Run Dashboard from the menu to run the default dashboard for that DataBlock.
The following pages describe how to:
- Save the results of a Dashboard
- Sort the results of a Dashboard
- Filter the results of a Dashboard
- Copy and print the results of a Dashboard