DataBlocks
Whether you are a DataBlock Designer, Report Writer, or Report Viewer, it can be helpful to have an understanding of the components of the DataBlock and of the relationship between DataBlocks and the various report types.
The DataBlock is the foundation from which all reports are created. DataBlocks are comprised of one or more forms used to construct the DataBlock's dashboard, and a report query, which builds the dataset used for writing reports.
Forms
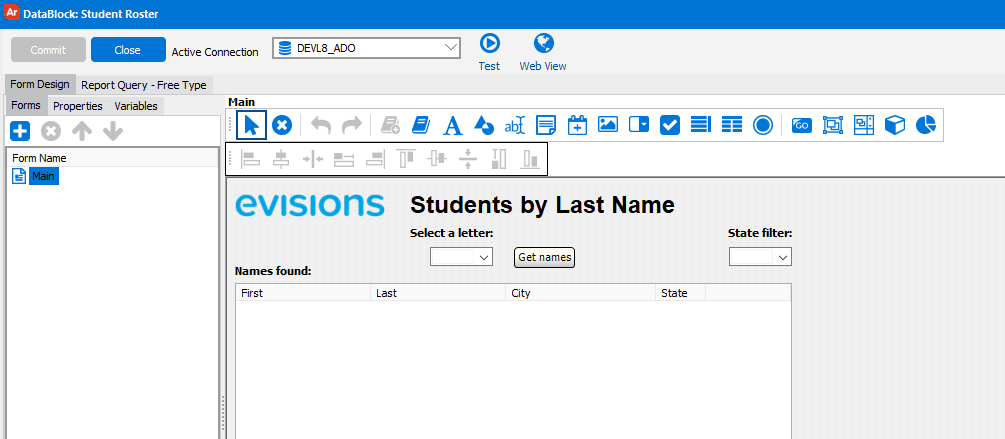
Forms are created on the Form Design tab of the DataBlock. When a DataBlock is first created, the first form is created for you automatically. You can use this form to design the dashboard that users see when running the DataBlock or one of its reports.

Forms can contain many different types of objects, such as list boxes, dropdowns, radio buttons, charts, and more. The majority of these objects can be configured to pull information from the database automatically using a SQL query.
Dashboards
Dashboards can be used to display information for the user, or may be used as parameter entry forms to customize the information shown on the dashboard or in the reports. Dashboards may have multiple forms, allowing users to switch between them to view different information.

In this example, the dashboard waits for the user to enter a letter of the alphabet. After clicking the Get names button, a list of students whose last names begin with that letter is shown. Users can also filter the list by state, if they choose to select a state in the dropdown.
Report Queries
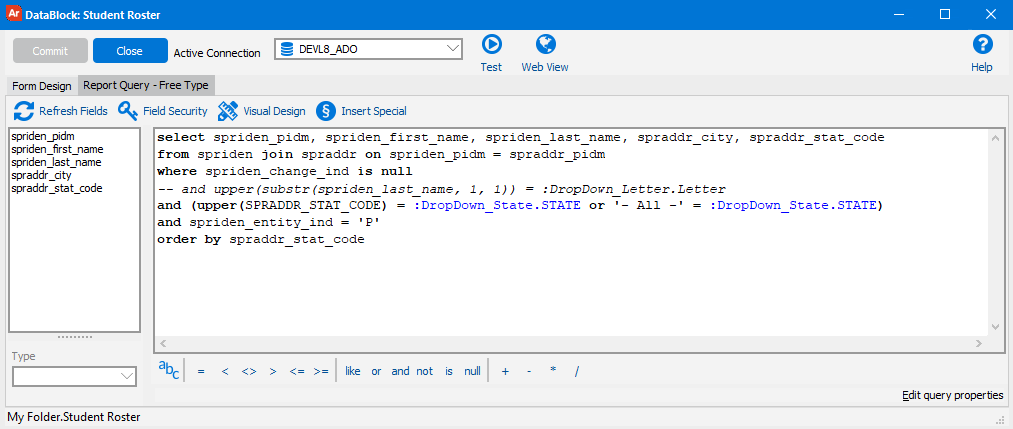
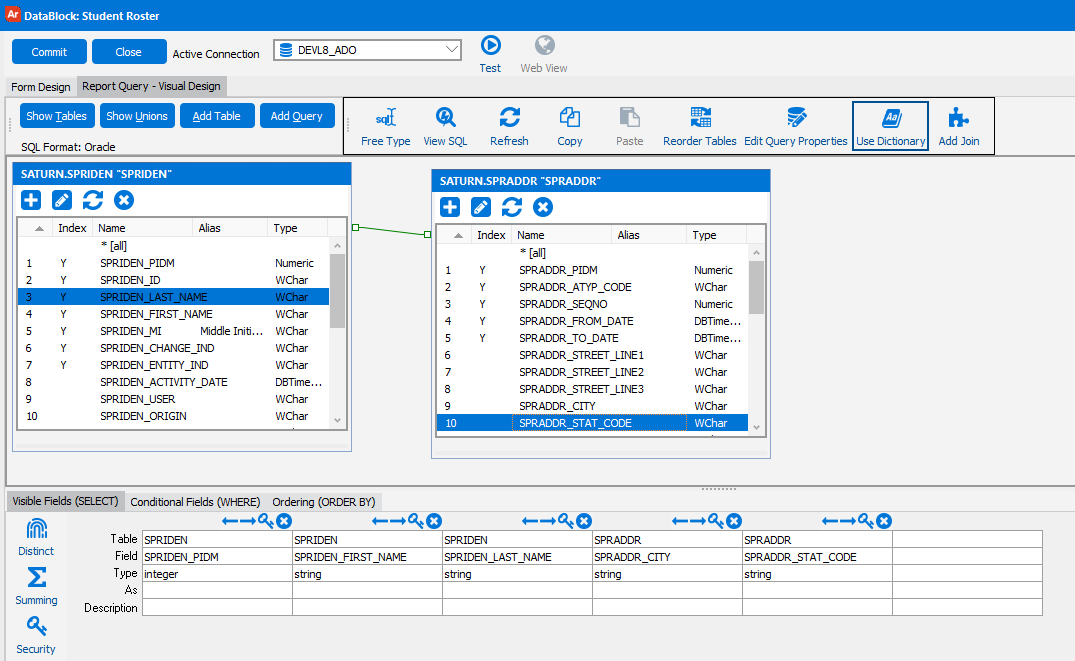
The Report Query tab in the DataBlock is where you design the SQL query that pulls the data that Report Writers will use to construct their reports. You can enter the query as free type SQL, or use the Visual Design tool to drag and drop the information you want and construct the SQL automatically.


Report Tree
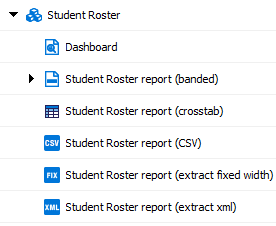
Dashboards and reports are children of DataBlocks in the report tree. All DataBlocks have a default dashboard, and Report Writers can create any number of reports.

All reports underneath a DataBlock use the same data that comes from its report query. The difference between the report types (banded, CSV, extract, or crosstab) is in how the data from the report query is displayed.