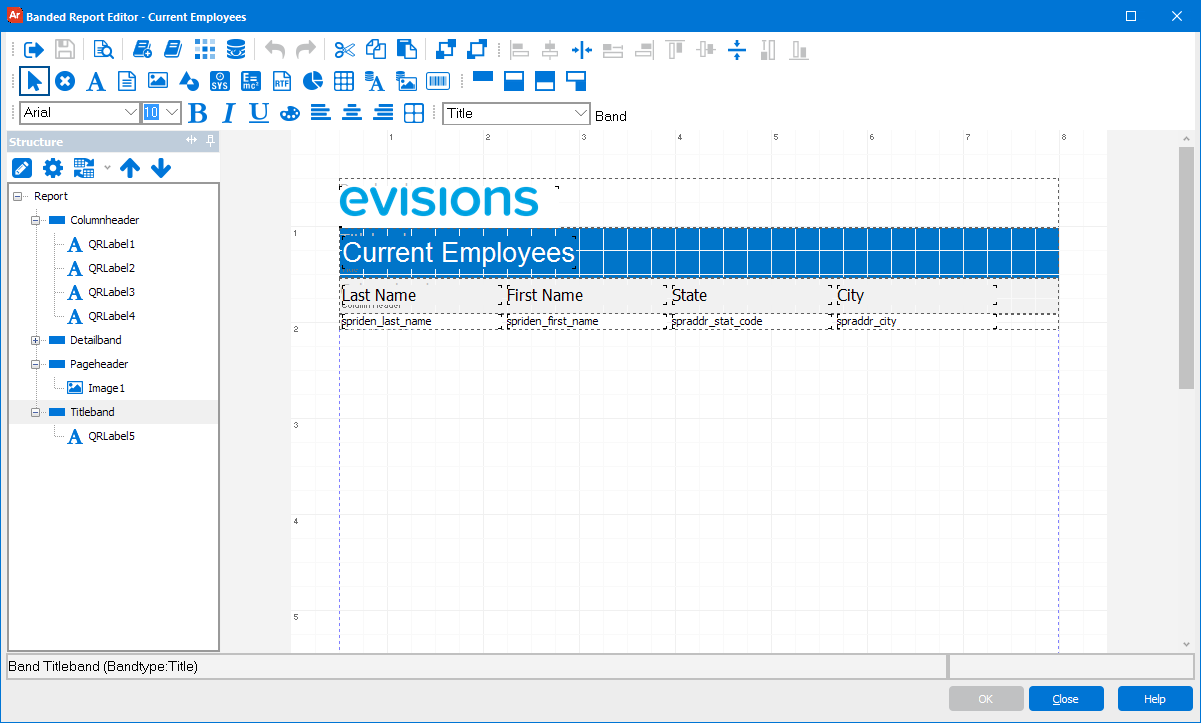
Banded Report Editor - Main Screen
The Argos Banded Report tool allows users to create fully formatted reports. The top part of the editor is the toolbar area, and beneath that is the work area. Banded Reports get their name from the report "bands" that are used to define their layout. Report Writers choose which bands they would like to include on their reports and what those bands contain. Bands are essentially placeholders on the page, and each works a little differently.
For example, if you add a Page Header band, it will print at the top of every page. The Title band is similar as it also prints at the top of the page (beneath the Page Header, if one exists), but it only prints on the first page. The Detail Band prints once for each row in the recordset. If you add a Summary band, it prints at the bottom of the last page (only), just above the Page Footer band (if one exists).
The different behavior of the various bands allow you to have almost complete control over exactly how you wish your report to look.
Structure Pane
The Structure pane on the left of the editor contains a structural view of all objects in the report. You can use this pane to select objects in the report. The tree-style view lets you quickly see which objects are children of other objects. Each object has an icon indicating its type, which is very helpful if you do not have a standardized naming convention that includes the object type.
Selecting an object on the report also selects that object in the object selection pane. If the object is a child of another object, the tree automatically expands to highlight the object you have selected.
In the example above, selecting the title band in the report expanded the Titleband object to show the text field named "TextField1" (which contains the text appearing in the title band). Alternatively, clicking on Titleband in the Structure pane would have selected the title band on the report.
After selecting an object you can use the Edit or Options buttons at the top of the Structure pane to edit the data or properties for that object.
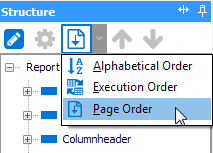
By default, objects in the Structure tree are sorted according to the order that they appear in the design window (page order). You can also display the list in alphabetical order. If you are using any functions that should execute prior to the execution of the band (for example, to set the color of an object in that band), you can switch to execution order view. When in execution order, you can move objects and bands up and down using the arrow buttons to ensure that any functions are calculated in the desired order.
Toolbars
The banded report editor has five toolbars which are grouped as follows:
![]()
![]()
![]()
![]()

![]()
Each of these toolbars can be moved around the screen as desired by grabbing their anchor point on the far left. Some of the tools on these toolbars are only available under appropriate circumstances. For example, several of the Alignment options are unavailable unless more than one object is selected.
General Tools
Note: Drafts are temporary saves that occur automatically while working in dashboards, banded reports, and crosstab reports. Drafts do not overwrite manual saves, so it is still suggested to save your work often. For more information please see Drafts.
Object Tools
| Button | Description |
|---|---|
|
|
Used to select and place objects or bands on your report. Hold down SHIFT to select multiple objects or CTRL to use this tool to draw a box to select multiple objects. You can also right-click with this tool to bring up options for selected objects. |
|
|
Deletes the selected object(s). If you remove something unintentionally, use Undo to restore it. |
|
|
Add a static text field to your report. You can use this to create an area of text, label for a field, etc. |
|
|
Add a Memo field to your report. Memo fields are more flexible than Text fields. They can contain multiple lines of text, can grow or shrink to accommodate the data, and can be used to display data from the dataset itself (using Expressions). There are also additional font formatting options and the ability to remove lines when empty (very useful when displaying multi-line street addresses, for example.) |
|
|
Add a static Image to your report. If you wish to add a Database Image, use the following tool designed for that purpose. |
|
|
Add a Shape to your report. You can add rectangles, circles and lines. There are additional options for shapes as well. |
|
|
Add a System Data Value to your report. These predefined values include date, time, title, page number and detail count. There are also additional formatting options and the ability to preface the value with static text. |
|
|
Add an Expression to your report. Expressions can include database fields, Argos functions, system variables, static text and combinations of each. There are also formatting options available. |
|
|
Add a Rich Text Format (RTF) field to your report. RTF fields contain greater formatting flexibility than Memo fields such as bullets, alignment, and complete font control. Database fields can be included in RTF fields by adding expressions to the field. |
|
|
Add a Chart to your report. The Chart Wizard will ask you to select your dataset, chart type and other options. |
|
|
Add a Line Grid to your report. You can define the number of rows and columns, as well as line and cell formatting. |
|
|
Add a Database Text Field. You'll be prompted for the field and other formatting options. |
|
|
Add a Database Image to your report. Database images can change with each record that is returned, so these can be a useful way to display employee photos, for example. You must also specify the MIME type of the image and include that within single-quotes (ex: 'image/bmp') |
|
|
Insert a Code 128 or USPS Intelligent Mail barcode. Barcode objects translate an alphanumeric variable into their corresponding barcode representation. |
Font Tools
Alignment Tools
The following tools can be used to align objects on your report. Two of the tools (Align to Horizontal Center of Parent and Align to Vertical Center of Parent) can be used with a single object or with multiple objects. The remaining alignment tools are for aligning objects in relation to each other. When using a multi-object alignment tool, select one object, then hold down the SHIFT key to select additional objects. The alignment tools will align all objects to the first object selected.
An alternate way to select objects is to hold down the CTRL key and draw a box that touches the objects you wish to select. When selected in this way, the alignment tool chosen will determine how the objects are aligned. For example, if you use the CTRL method to select several objects and choose Align to Left Side, it will align all objects to the left-most object.
The two Stretch tools require that you select three or more objects.
Note: When selecting multiple objects, all objects you are selecting must be within the same report band. If you need to align objects across bands, use the alignment guide lines that appear when moving an object close to another one.
| Button | Description |
|---|---|
|
|
(Multiple Objects) Align the selected objects by their left hand sides. |
|
|
(Multiple Objects) Align the selected objects by their horizontal centers. |
|
|
Align the selected object(s) to the horizontal center of their parent. |
|
|
(Three or More Objects)Stretch the selected objects to the same horizontal size. |
|
|
(Multiple Objects) Align the selected objects by their right hand sides. |
|
|
(Multiple Objects) Align the selected objects by their tops. |
|
|
(Multiple Objects) Align the selected objects by their vertical centers. |
|
|
Align the selected object(s) to the vertical center of their parent. |
|
|
(Three or More Objects)Stretch the selected objects to the same vertical size. |
|
|
(Multiple Objects) Align the selected objects by their bottoms. |
Band Tools
| Button | Description |
|---|---|
|
|
Add a new band to your report. You cannot add Band Groups (Group Headers), Child bands or sub detail bands in this way (use the following tools designed specifically for that purpose). Note that band placement for all band types is determined by the type of band added (page headers at the top, page footers at the bottom, etc.). |
|
|
Add a child band to your report. Child bands always print just beneath their parent (which must be chosen). |
|
|
Add a band group (group header). New band groups are always added adjacent to the detail band. If you wish to have multiple band groups, add the outermost first, and work your way in. You must define which field the group is based on and your dataset should be sorted accordingly. |
|
|
Add a sub detail band to your report. Sub detail bands print beneath the detail band. These bands are typically used when you wish to include additional datasets for each record in the main dataset. They can also be useful when pulling in data from different data sources. |
Object Editor
You can use the Object Editor to change the content of data and text fields.
DPI Settings
The Designed DPI dropdown at the bottom of the window indicates the DPI that the report was last edited in. For example, if Windows is set to 125% scaling, this corresponds to a DPI of 120. This setting updates automatically when you save the report, and should not usually need to be edited manually.
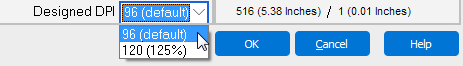
The one situation where you might need to change this setting is if you are editing a report that was last edited using an older version of Argos that did not support DPI scaling. In this case, you might notice that a report creating using a different DPI setting looks like its scaling is incorrect. For example, it might have controls in the wrong location, fonts that are too large or small, or overlapping elements. The Designed DPI in this situation would be showing as "unknown". You can fix this by changing the Designed DPI to the appropriate setting, and saving the report. The report should then display correctly the next time it is opened.
Warning: There is currently a bug in Argos where the Designed DPI does not update automatically if you use the OK button at the bottom of the banded report editor to save your changes. To avoid this, if you are editing a report that was last edited using a different DPI setting, you should make sure to use the Save button in the upper left of the editor, instead of the OK button in the lower right.
If you need additional help creating Banded Reports, refer to the Getting Started with Banded Reports page.