Chart Wizard - Chart Legend and Titles
The first step is to select which item (object) you want to work with. You can modify the Legend itself, or any of the other titles:
- Main Title
- Sub Title
- Footer
- Sub Footer
- Left Axis Title
- Bottom Axis Title
Once an item is selected it is important to remember that all of the changes you make in the tabs below are for that one specific item.
To see an overview of the steps in the Chart Wizard go to the Chart Wizard Introduction.
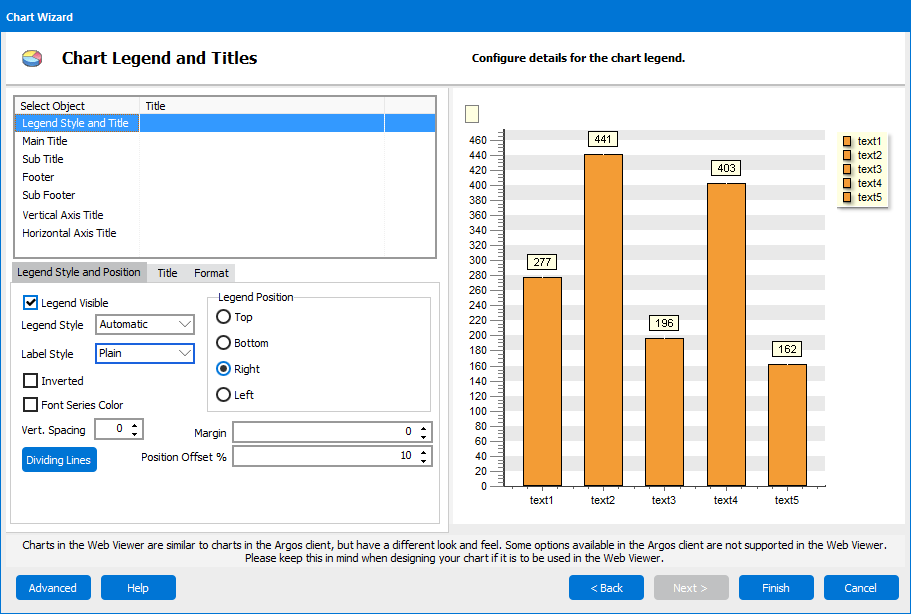
Here you set the properties for the chart legend.
- Legend Visible - check here to display the legend.
- Legend Style - determines what values are used in the legend.
- Label Style - sets the style of the labels.
- Inverted - reverses the order of the items in the legend.
- Font Series Color - assigns the font color of a given series to the related item in the legend.
- Vert. Spacing - sets the vertical spacing between items in the legend.
- Dividing Lines - adds lines between the items in the legend to divide them.
- Legend Position - select where in relation to the chart you want the legend (left, right, top, bottom).
- Margin - controls the margin between the graph (i.e., gauge or bar chart) and the legend.
- Position Offset % - controls the positioning of the legend relative to the top or side of the chart depending upon the legend position.
Title Tab
The Title tab is where you enter the text for the title you want as well as set some properties.
- Visible - show or hide the title.
- Font - sets the font properties for the title.
- Alignment - controls the alignment of the title on the chart.
- Text - enter the title here.
Format Tab
The Format tab is where you set properties to control the look of the title.
- Adjust Frame - when this box is checked, the size of the frame adjusts to the size of the title. If it is not checked the width of the frame is set to the default width. Note that the Transparent checkbox on the Format tab must not be checked in order to see this effect.
- Transparent - show or hide the title.
- Background Color - sets the background color for either the legend or title selected.
- Pattern - sets the pattern for either the legend or title selected.
- Border - sets the border for either the legend or title selected.
Button Navigation
- The Advanced button opens the Advanced Editor. In the Advanced Editor you can customize your chart further, but keep in mind that once you edit a chart using the Advanced Editor you will not be able to edit it again with the Chart Wizard.
- The Help button opens the help page for this screen.
- The Back button takes you to the Configure Theme and Panel screen.
- The Finish button exits the wizard and builds your chart. It is available once you have created at least one complete series. In order to be complete, a series must have a name, a dataset selected, and values chosen for Label and Value. All of these fields are on the main Series Manager screen and Data tab.
- The Cancel button cancels the changes you have made and exits out of the Chart Wizard altogether.
Need More Help?
If you need additional help creating charts, refer to the Getting Started with Charting page.